Terry Knight
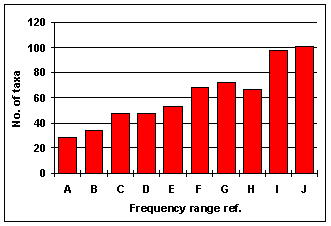
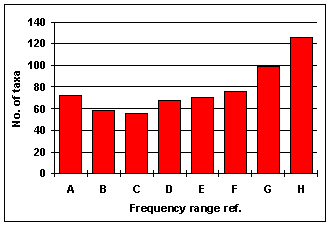
Percentage frequency of trips in which a taxon was recorded (tables and histograms)
PERCENT FREQUENCY |
|
|
PERCENT FREQUENCY | ||||||
From |
To |
Range ref. |
NO. OF TAXA |
|
|
From |
To |
Range ref. |
NO. OF TAXA |
100 |
50.01 |
A |
28 |
|
|
100 |
50.01 |
A |
72 |
50 |
25.01 |
B |
34 |
|
|
50 |
25.01 |
B |
58 |
25 |
12.51 |
C |
48 |
|
|
25 |
12.51 |
C |
56 |
12.5 |
6.26 |
D |
48 |
|
|
12.5 |
6.26 |
D |
68 |
6.25 |
3.13 |
E |
53 |
|
|
6.25 |
3.13 |
E |
70 |
3.12 |
1.57 |
F |
68 |
|
|
3.12 |
1.57 |
F |
76 |
1.56 |
0.79 |
G |
72 |
|
|
1.56 |
0.79 |
G |
99 |
0.78 |
0.4 |
H |
67 |
|
|
0.78 |
0.4 |
H |
126 |
0.39 |
0.2 |
I |
98 |
|
|
|
|
|
|
0.19 |
0.1 |
J |
101 |
|
|
|
|
|
|
|
|
|
|
|
|
|
|
|
|
Percentage frequency of trips (out of 833) in which a taxon was recorded within the first 50 taxa seen | Percentage frequency of trips (out of 200) in which a taxon was recorded within the first 100 taxa seen | ||||||||
Return to Article |